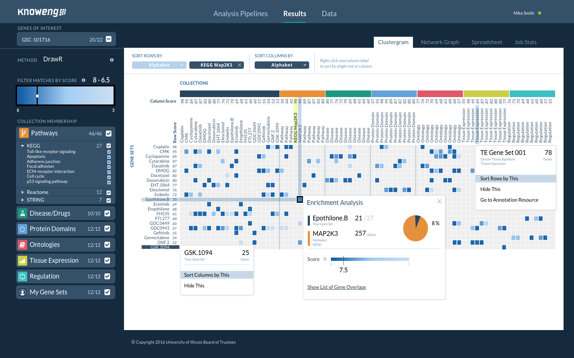
Analytics Pipelines in the KnowEnG system
You may choose from several analysis pipelines to deploy on your data, e.g., Gene Prioritization, Sample Clustering, Gene set characterization, Gene Signature Analysis, Phenotype Prediction, etc. Each pipeline is a complex workflow involving algorithms for data processing and normalization, application of the core machine learning or statistical algorithm, as well as post-processing & visualization.
Pipeline: Sample Clustering
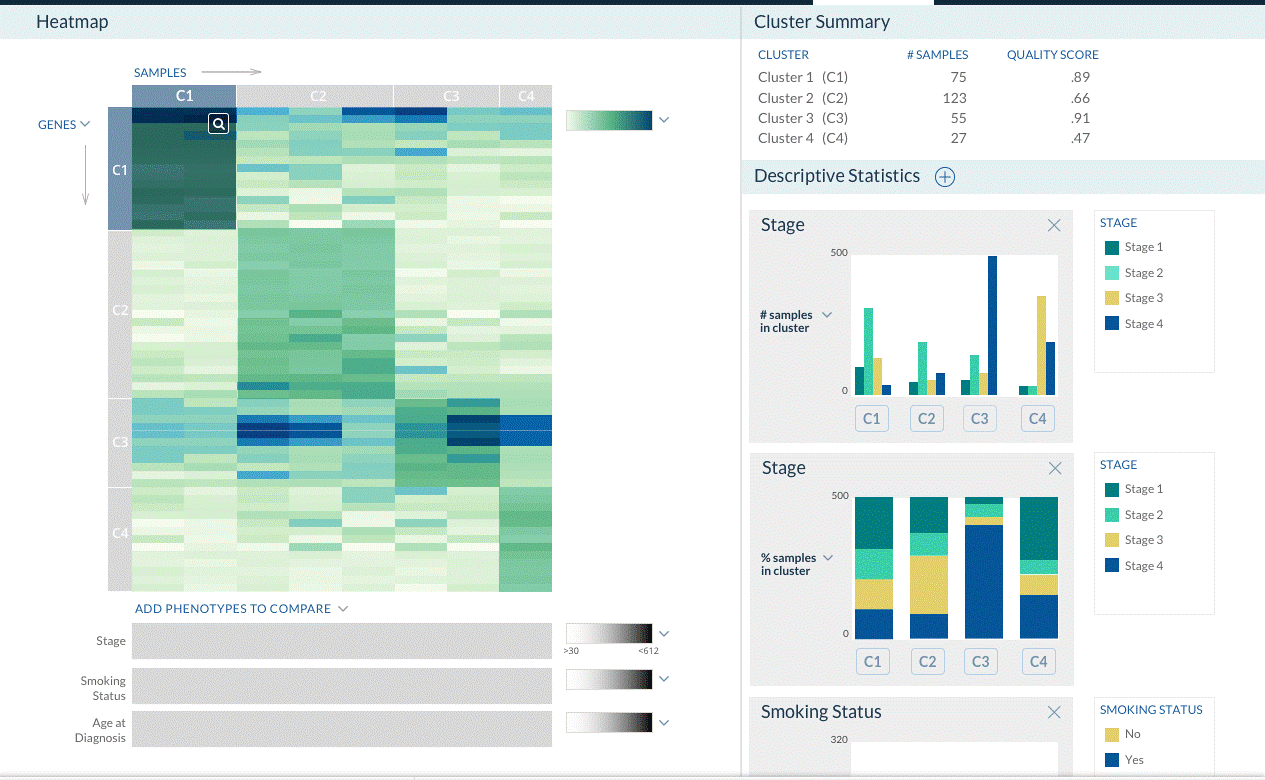
You submit a spreadsheet that contains gene-level profiles (e.g., transcriptomic, somatic mutations, or copy numbers) of multiple biological samples. You then want to find clusters of the samples that have similar signatures (e.g. subtypes of cancer patients). In addition, you may also have phenotypic descriptions (e.g., drug response, patient survival, etc.) for each sample. This pipeline uses different algorithms to cluster the samples and scores the clusters for their relation to provided phenotypes. Clustering can be done in a Knowledge Network-guided mode, and with optional use of bootstrapping to obtain robust clusters.
Technical footnote: Network-guided mode performs Network-smoothing of omics profiles, followed by non-negative matrix factorization (NMF) and consensus K-means clustering across bootstrap samples of data set.
Pipeline: Gene Prioritization
You submit a spreadsheet of gene-level transcriptomic (or other omics) profiles of a collection of biological samples. Each sample is also annotated with a numeric phenotype (e.g., drug response, patient survival, etc.) or categorical phenotype (e.g., cancer subtype, metastatic status). This pipeline scores each gene by the correlation between its “omic” value (e.g., expression) and the phenotype, and reports the top phenotype-related genes. Gene prioritization can be done in a Knowledge Network-guided mode, and with optional use of bootstrapping to achieve robust prioritization.
Technical footnote: Network-guided mode performs Network-smoothing of omics profiles, followed by correlation analysis and two additional phases of random walk with restarts with re-starts to identify phenotype-related genes.
Publication: Knowledge-Guided Prioritization of Genes Determinant of Drug Response Reveals New Insights into the Mechanisms of Chemoresistance.
Amin Emad, Junmei Cairns, Krishna R. Kalari, Liewei Wang and Saurabh Sinha
Pipeline: Gene Set Characterization
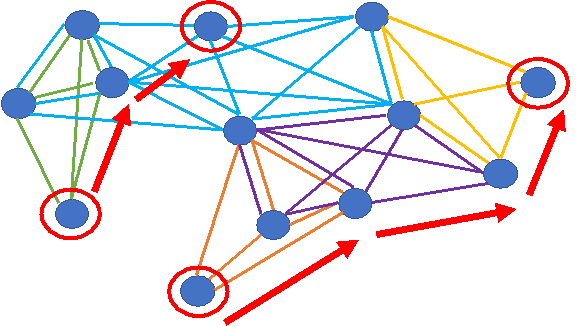
You have a set of genes and would like to know if those genes are enriched for a pathway, a Gene Ontology term, or other types of annotations. This pipeline tests your gene set for enrichment against a large compendium of annotations pre-loaded into KnowEnG. You may use a standard statistical test or choose a Knowledge Network-guided mode that uses the DRaWR, NetPath or MetaGeneRank algorithms.
Technical footnote: DRaWR uses discriminative random walk with restarts on a heterogeneous graph, NetPath is based on embedding gene and property nodes into a common low-dimensional vector space, and MetaGeneRank uses meta-paths to identify connectivity patterns characteristic of the gene set before using classification techniques with these patterns.
Publication: Characterizing gene sets using discriminative random walks with restart on heterogeneous biological networks.
Charles Blatti and Saurabh Sinha
Bioinformatics, Volume 32, Issue 14, 15 July 2016, Pages 2167–2175, https://doi.org/10.1093/bioinformatics/btw151
Forthcoming pipelines
Pipeline: Literature mining with gene sets and term sets
You define a corpus of interest (e.g., papers related to ‘heart disease’), from all of PubMed. You also provide a set of terms (e.g., ‘arrhythmia’, ‘cardiomyopathy’, ‘ischemic heart disease’), defining subsets of the corpus and a set of genes of interest. This pipeline searches the defined corpus of papers for significant occurrences of specified genes (and their synonyms), ranking the genes for relevance to each specified term. This specialized tool uses a data-driven, semi-supervised text mining paradigm to mine massive collection of biomedical texts. Top genes identified as relevant to a term can then be explored further through the gene set characterization pipeline or signature analysis pipeline.
Technical footnote: This tool is powered by a combination of cutting-edge phrase-mining algorithms, namely SegPhrase+ & ToPMine, and a phrase-based network embedding technique ‘Large-scale Information Network Embedding’ (LINE).
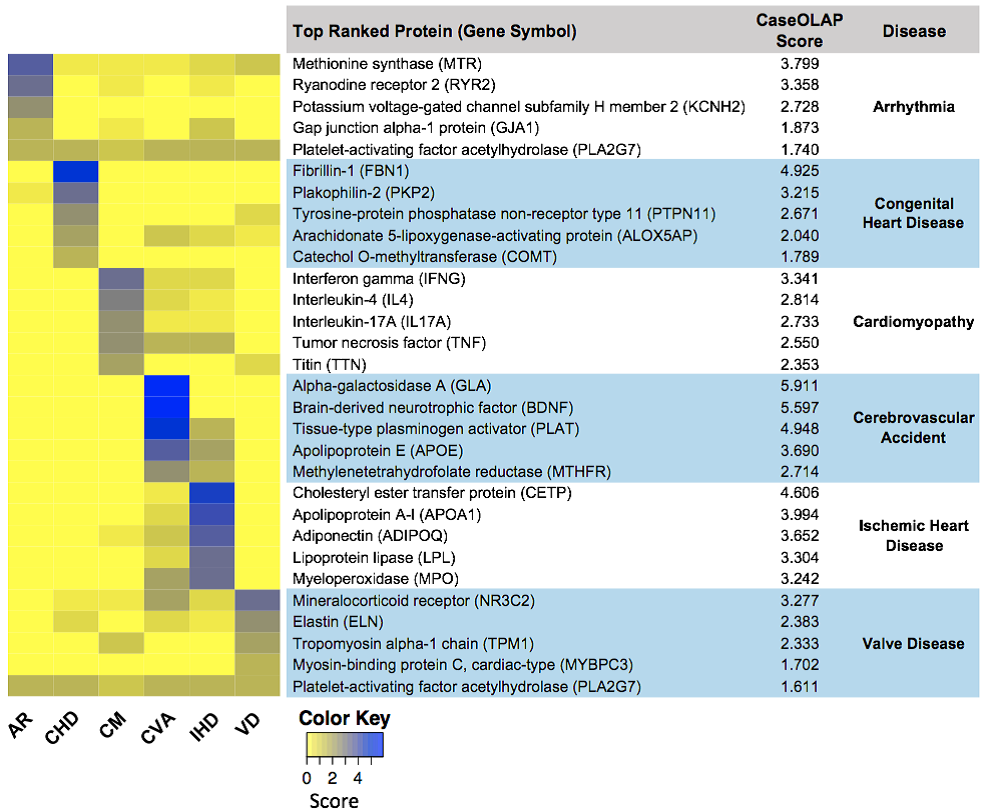
Pipeline: Signature Analysis
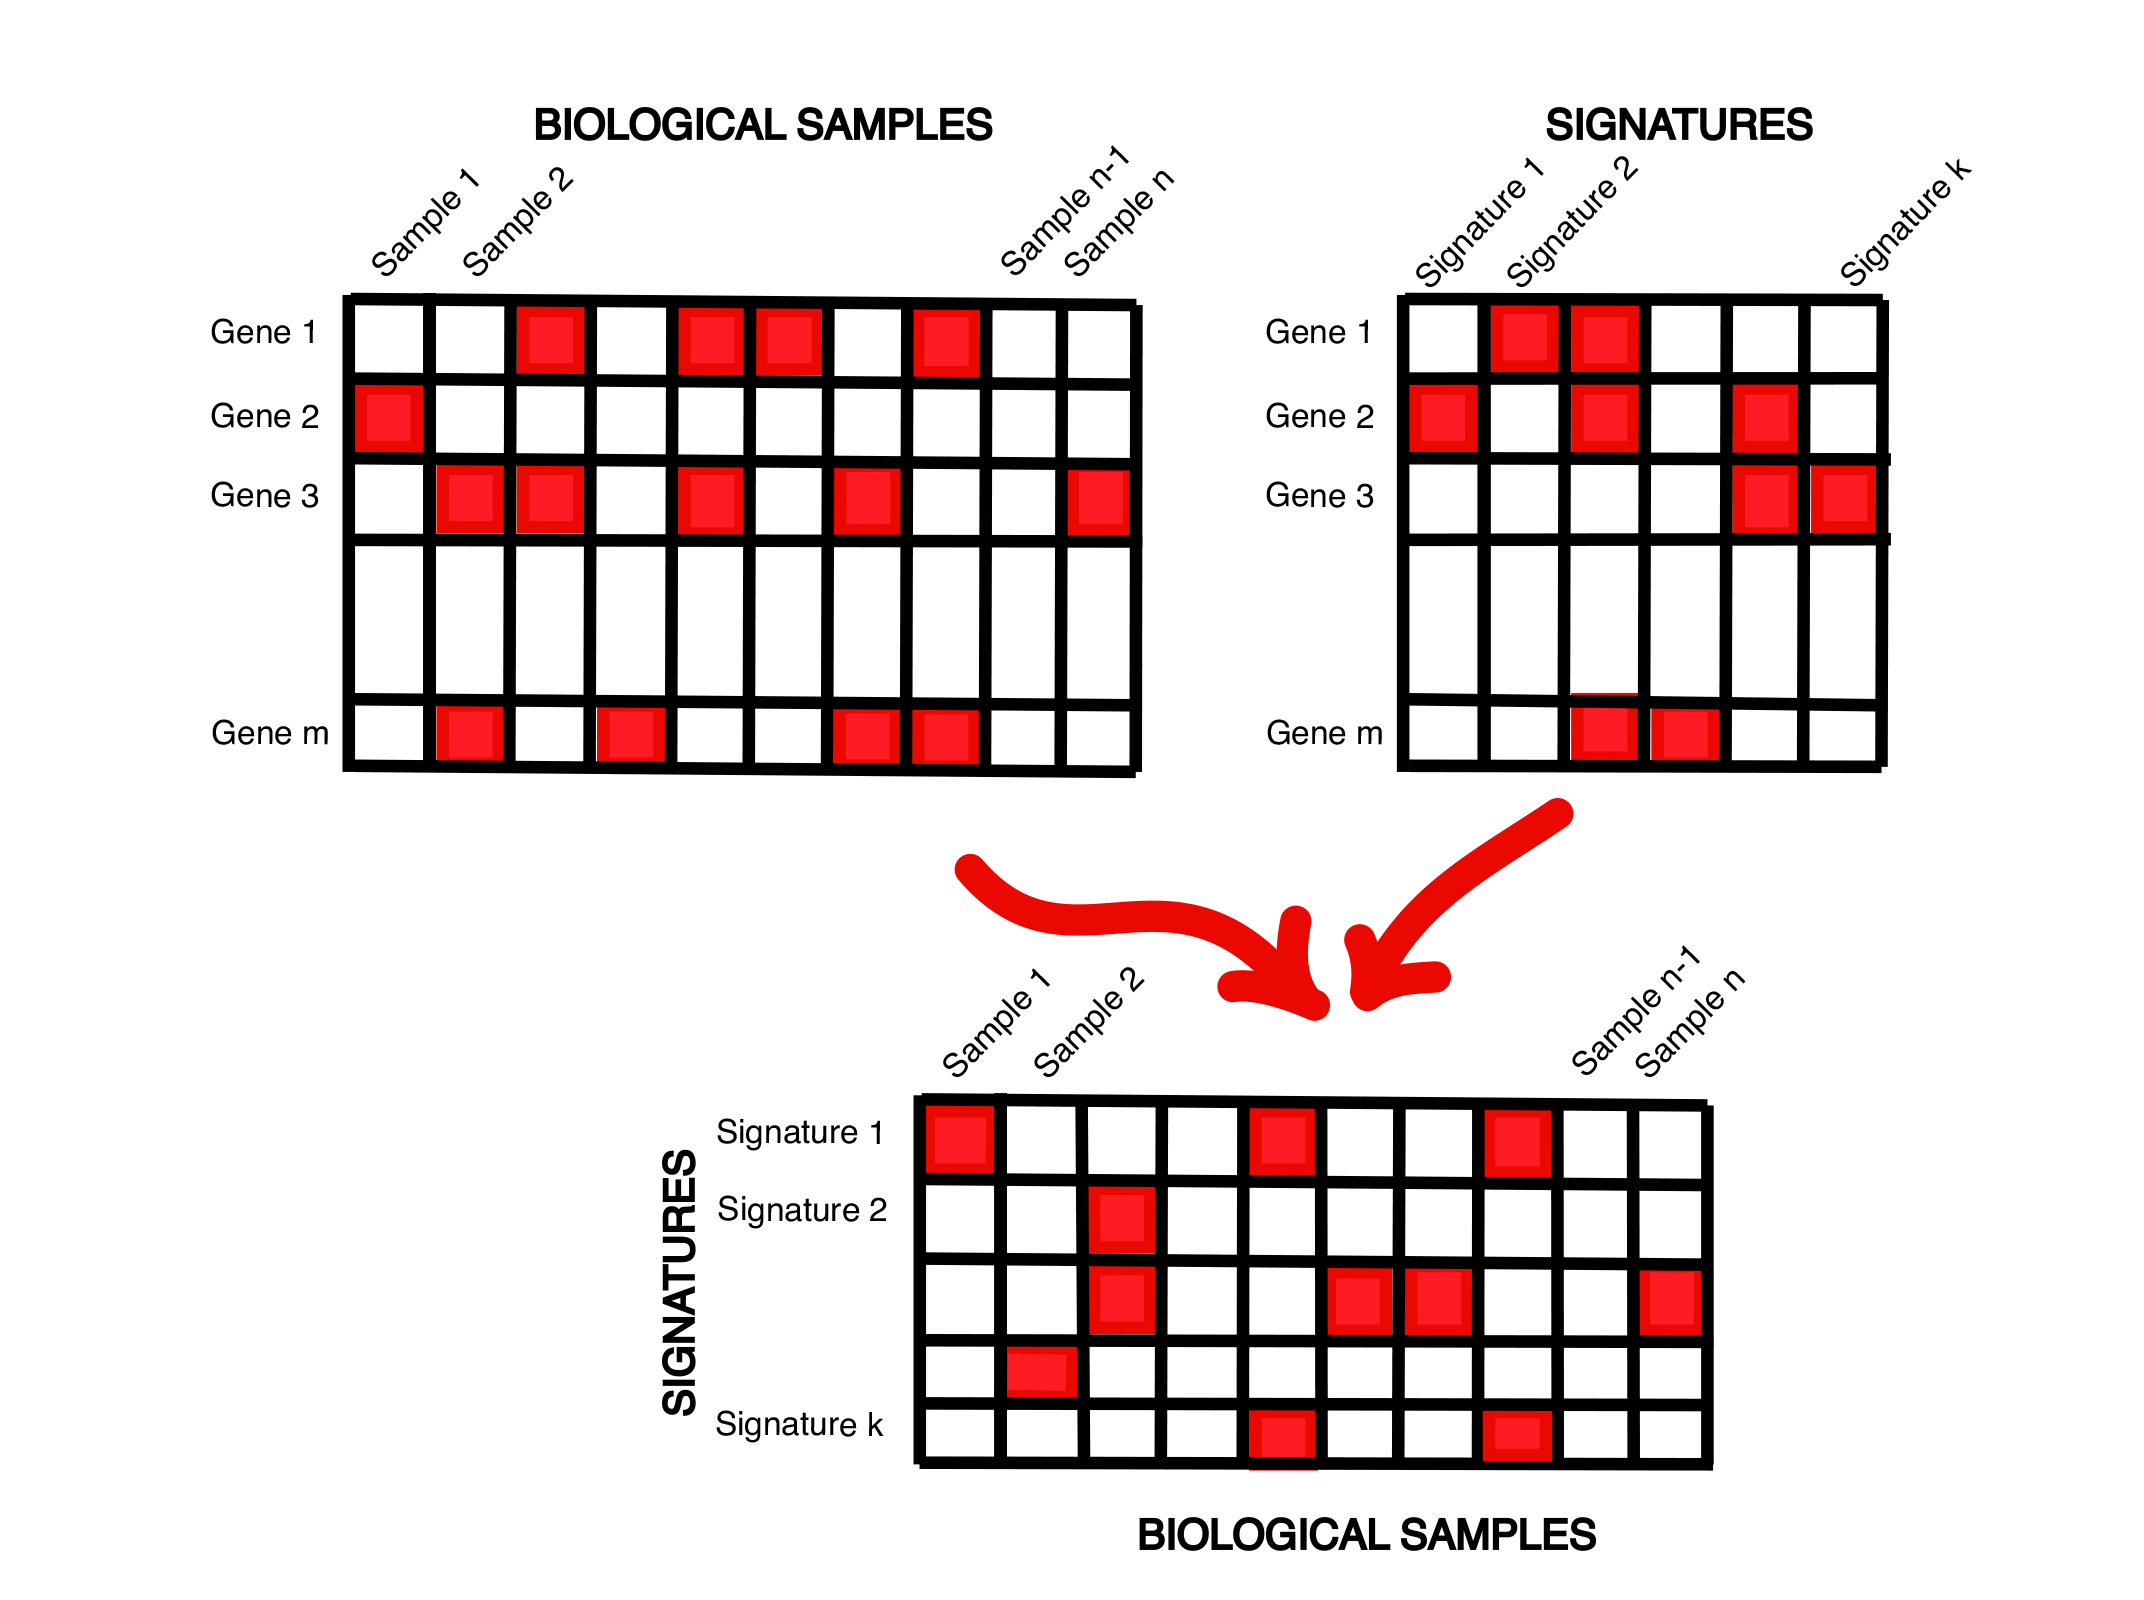
You submit a spreadsheet of transcriptomic profiles of a collection of biological samples, and upload a set of expression signatures relevant to the phenotype of interest, e.g., PAM50 signatures. This pipeline maps the provided transcriptomic profiles to their best matching signatures, for instance resulting in subtype assignments to patients. It can also describe each biological sample as a set of numeric scores representing how well the sample matches each signature. The resulting spreadsheet of ‘signature profiles’ of the original biological samples can then be analyzed using sample clustering or can be treated as molecular phenotypes to be examined using gene prioritization or phenotype prediction pipelines.
Technical footnote: This pipeline matches signatures using simple, commonly used measures such as correlation coefficient, but will also support more advanced knowledge network-guided methods of signature matching.
Pipeline: Phenotype Predictive Modeling
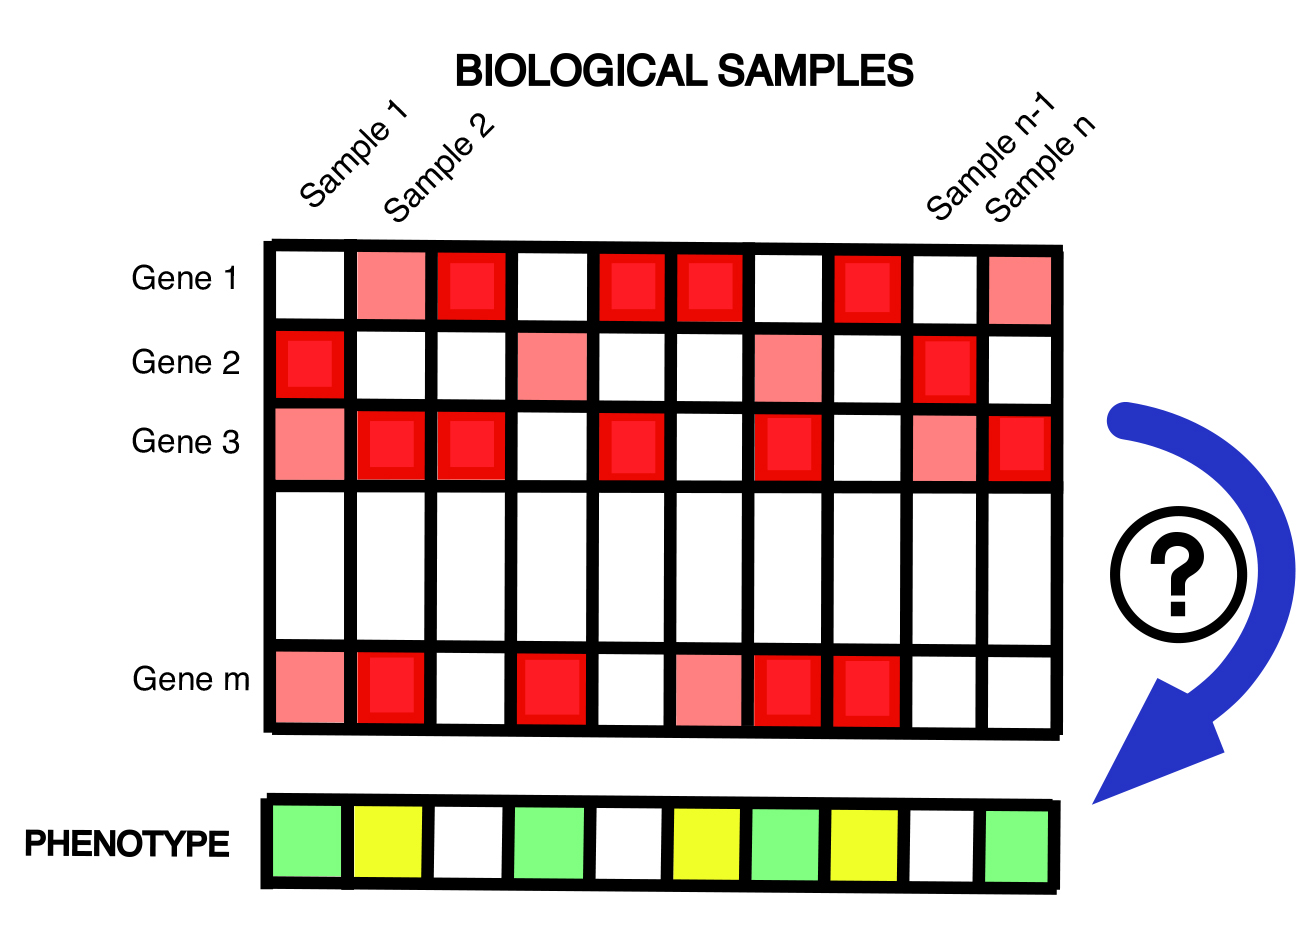
You submit a spreadsheet of gene-level transcriptomic (or other omics) profiles of a collection of biological samples. Each sample is also annotated with a numeric phenotype (e.g., drug response, patient survival, etc.) or categorical phenotype (e.g., cancer subtype, metastatic status). This pipeline learns to predict phenotype from –omic profile of a sample, and can be done using standard machine learning tools or in a Knowledge Network-guided mode. This pipeline also supports survival analysis through Cox regression models.
Technical footnote: The standard tools used include high dimensional regression and classification methods that use regularization, and the Network-guided mode will use generalized elastic net and network-induced classification kernels.
Pipeline: Gene Regulatory Network Reconstruction
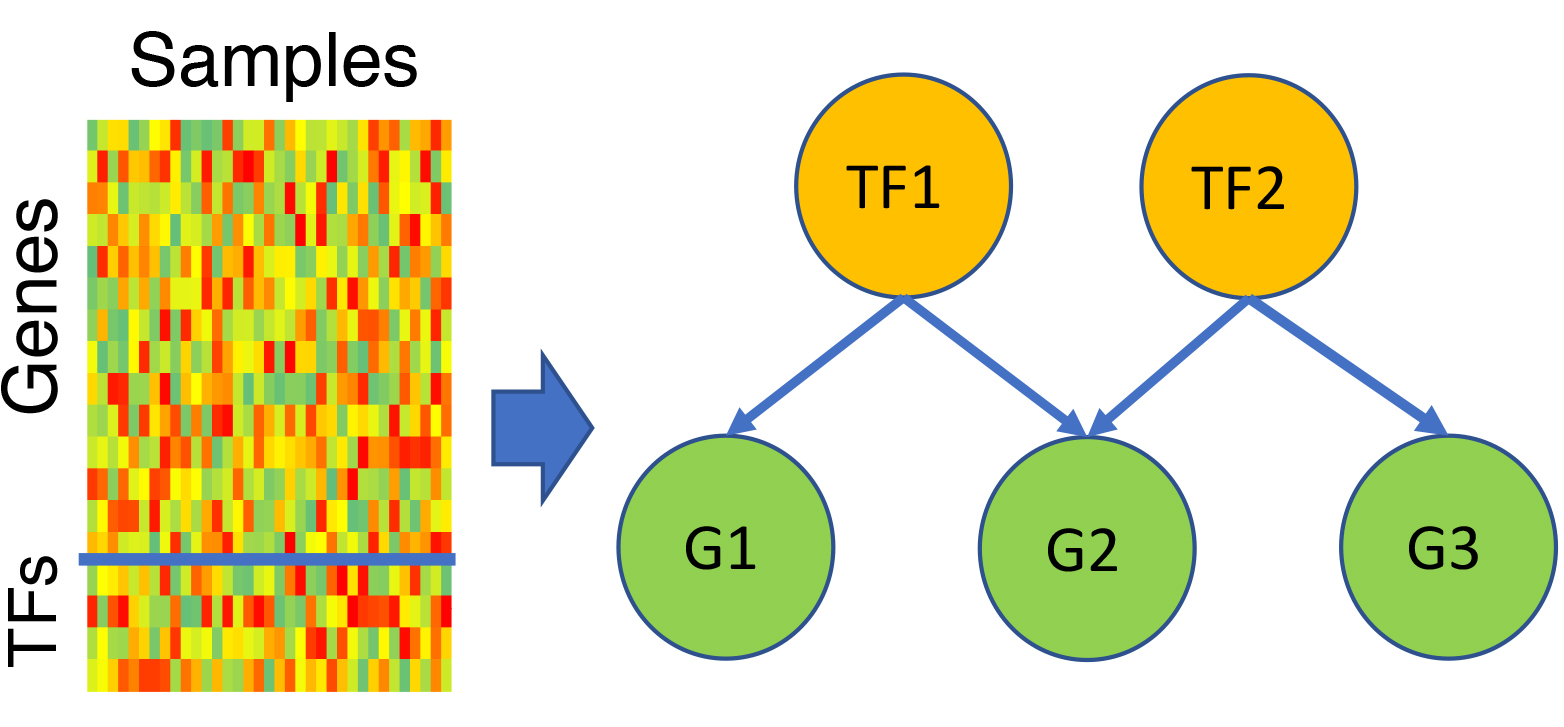
You submit a transcriptomic spreadsheet with samples as columns and genes as rows, of which some genes are marked as transcription factors (TFs). This pipeline learns a model to predict each gene’s expression as a function of expression levels of a few TFs, which are automatically selected by the model. Key TF regulators can be identified in this way, and predicted targets of any TF can be explored further for systems level properties or mechanistic bases of co-regulation. Phenotype-relevant GRNs: Optionally, the samples may be annotated with phenotypic information, and the pipeline will learn TF-gene regulatory relationships that are especially relevant to the phenotype.
Technical footnote: GRN construction is seen as a multi-variate regression task, and TF expression variables are used as covariates in a least angle regression model with regularization. Phenotype-relevant GRN discovery is implemented as a probabilistic graphical model integrating gene-phenotype relationship with TF-gene relationship.
Pipeline: Publication Search
With this unique literature mining tool you may provide a set of terms such as genes, diseases, compounds, etc., and ask for papers from PubMed that are most relevant to the provided set of terms. Importantly, the tool automatically detects the different types of terms in your query and attempts to retrieve papers relevant to the set of terms and not merely individual terms.

Pipeline: Multi-omics Analysis to Identify Regulatory Mechanisms
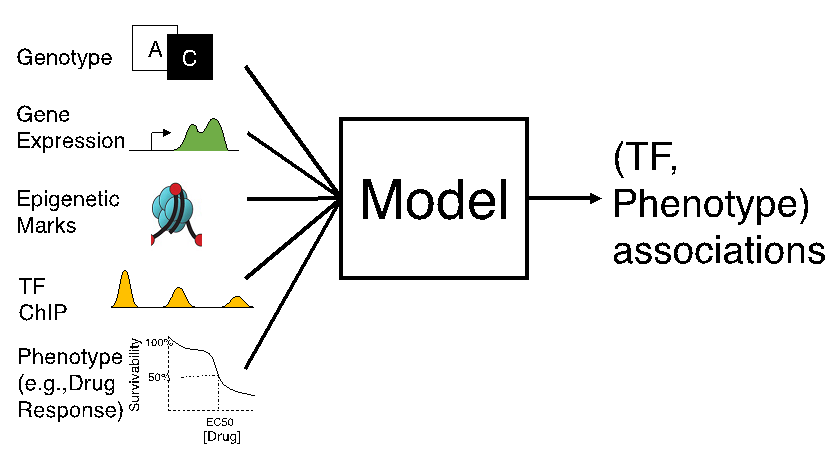
You have transcriptomic data along with phenotypic information (e.g., cytotoxicity of cell lines, or cancer subtype) on a collection of biological samples. You also have genotype and/or epigenotype (e.g., histone mark profiles) on those samples, and would like to use all of these data to understand the gene regulatory mechanisms underlying your phenotype. The pGENMi algorithm examines genotype and/or epigenotype data uploaded by you, in conjunction with TF-DNA binding data from ENCODE project, to find evidence of a transcription factor’s regulatory influence on genes. It combines such multi-faceted regulatory evidence of that TF’s role with information about gene expression associations with a phenotype. It reports TFs and TF-gene relationships that can be linked to the phenotype.
Technical footnote: pGENMi uses a probabilistic graphical model to integrate multi-omics data sets in principled ways.

