Visualization
A critical aspect of KnowEng’s utility is how well biologists interface with the powerful analytics and extensive Knowledge Network. Transforming numerical abstractions and complex relationships into visual and textual form, and putting these in a biological context that matches a researcher’s cognitive model, is key to harnessing the power of these resources and their research data. These tools enable scientists to explore a complex network, develop and test hypotheses, and receive a clear understanding of the analysis process and its limitations so that there are no “black boxes”.
The approach we take when creating interactive visualization concepts is to understand the series of questions the researcher is asking of the data. We use this knowledge to develop a structure and visual hierarchy that reflects the hierarchy of the researcher’s thought process. The result is a different organization and view than what is typically seen when the content is organized based on the technical processes, or by attempting to communicate all of the complexity and details at once.
Our solutions incorporate information design principles we have used successfully in the past: 1) providing qualitative overviews coupled with quantitative details, 2) using various methods that facilitate efficient comparison, 3) illustrating relationships between content, 4) providing multiple ways to look at the same data to minimize misrepresentation and maximize the potential for insight, and 5) providing relevant context for analysis, and evidence for confirmation, 6) facilitating fluid movement between views and data. Our process for developing visualization concepts and tools includes close collaboration and testing with researchers and clinicians from Mayo Clinic and and faculty from the University of Illinois.
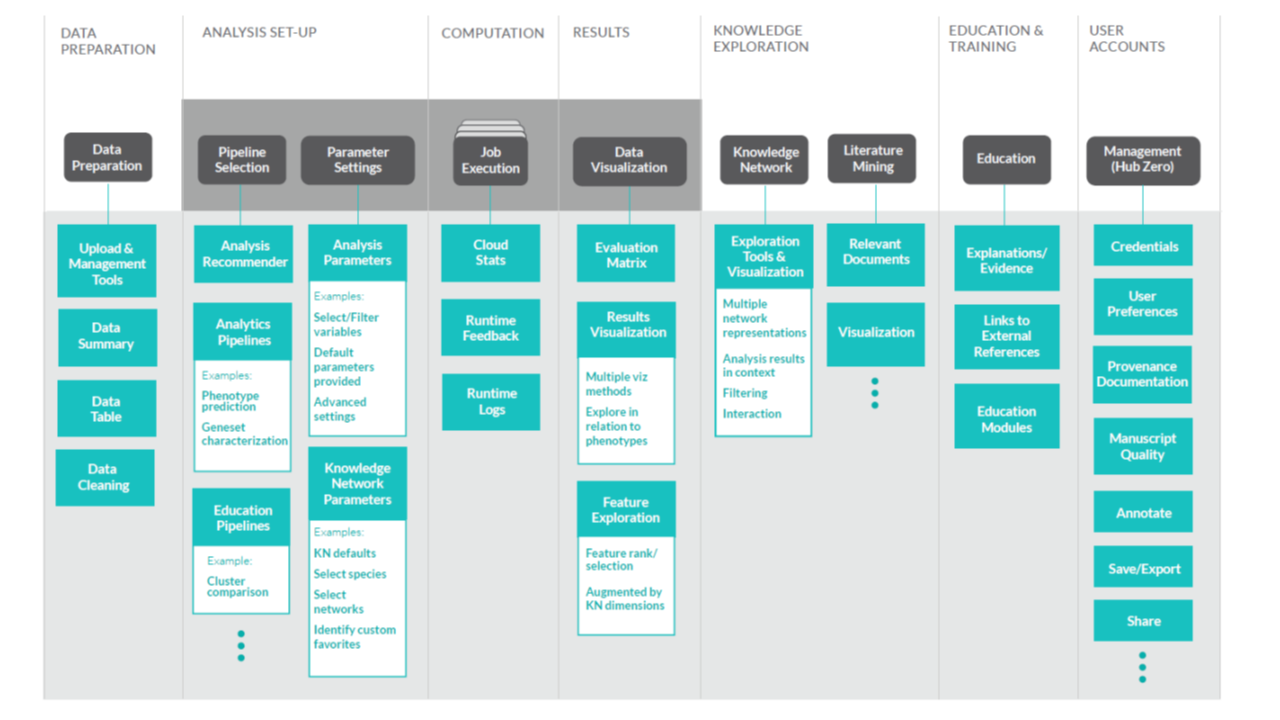
KnowEnG Front-End Components
Investigators
Colleen Bushell
Matt Berry
Lisa Gatzke
- Angular 2 web framework – rapid development of highly interactive, single-page views
- MongoDB database with OpLog – short-term and long-term persistence of user data
- Python Eve – RESTful web services backed by MongoDB
- Nginx web server – security
- HTML5 with SVG – standards-based, cross-platform vector graphics within pages, and canvas bitmap graphics
- Bootstrap with customizations – typography, widgets, icons, and other graphical elements that scale intelligently
- d3.js – data-driven visualization libraries leveraged
- Adobe Illustrator – creation of images and graphics
- InVision – UX prototyping platform
- Sketch – high-fidelity UI mockups
- Zeplin – collaborative UI specifications tool